
I recently posted about how to use our free industry benchmarking tool and all the different kinds of reports you can create from it. We used a selection of top auto manufacturers as our sample data set, and I’m going to riff on that theme again here to introduce you to another must-try Adthena calculator: our free Share of Search (SoS) tool.
There are currently 97K Google searches performed every second, and search is growing fast. By measuring your share of all those intent signals, you can gain a reliable and predictive idea of your brand’s market share. Search traffic represents the highest-intent traffic there is, so the SoS metric is definitely something you should be tracking. You can get a quick introduction to the metric here.
Why measure your SoS?
With accurate SoS data, you can answer all sorts of important questions about your overall market strategy. How does your brand performance compare to that of your competitors? How do different brands within your own portfolio stack up against one another? How much available demand are you actually capturing?
Using our calculator, you can compare your share of all search traffic to any two competitors for a select group of search terms in the location of your choice.
Nissan, Tesla, and Ford: What does the intent say?
Here, we’ll take a look at the automotive manufacturing industry and, specifically, searches for terms relevant to the electric vehicle (EV) market. Here’s how that looks on the calculator.
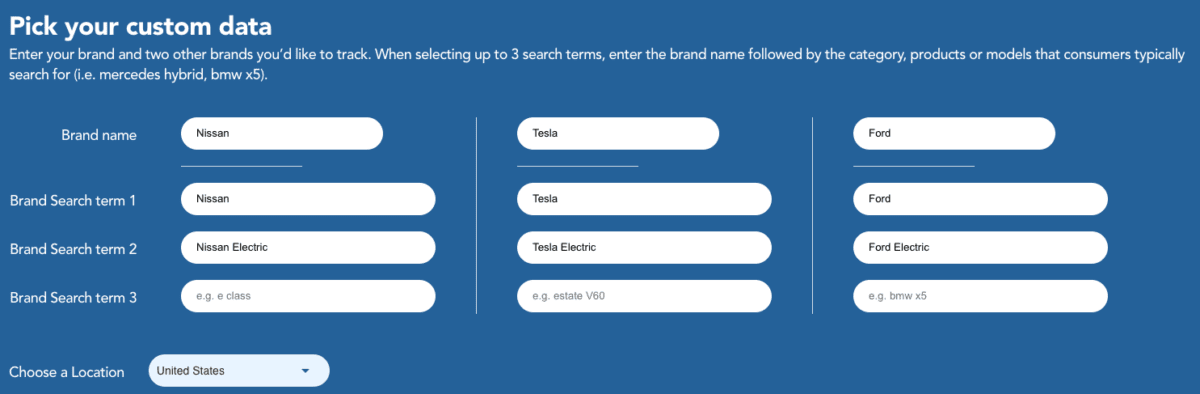
If we enter basic brand search terms for three EV makers in the US (you can choose from 10 different countries in the calculator), we can look at the data in a number of ways.
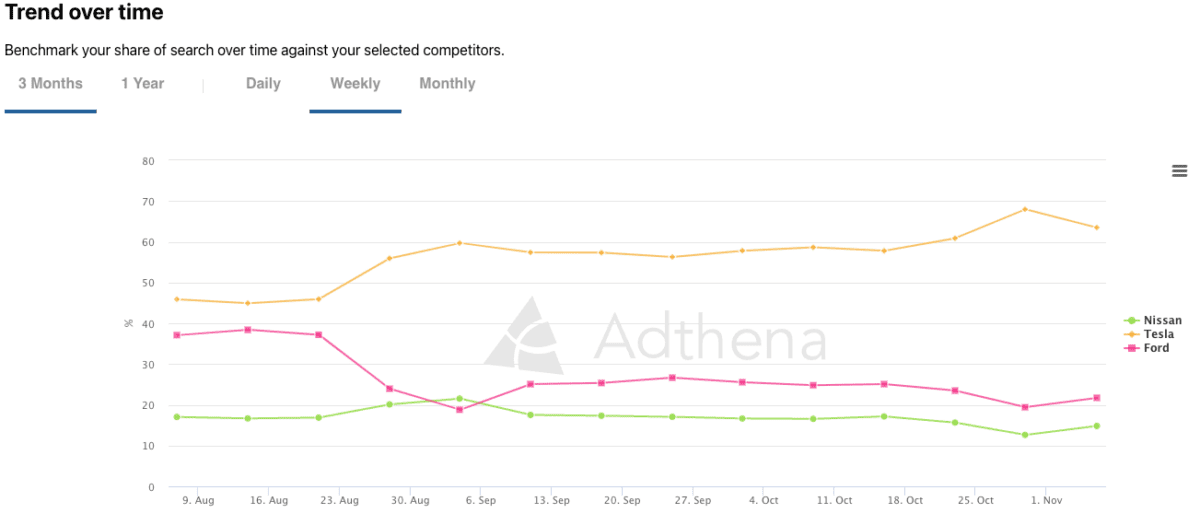
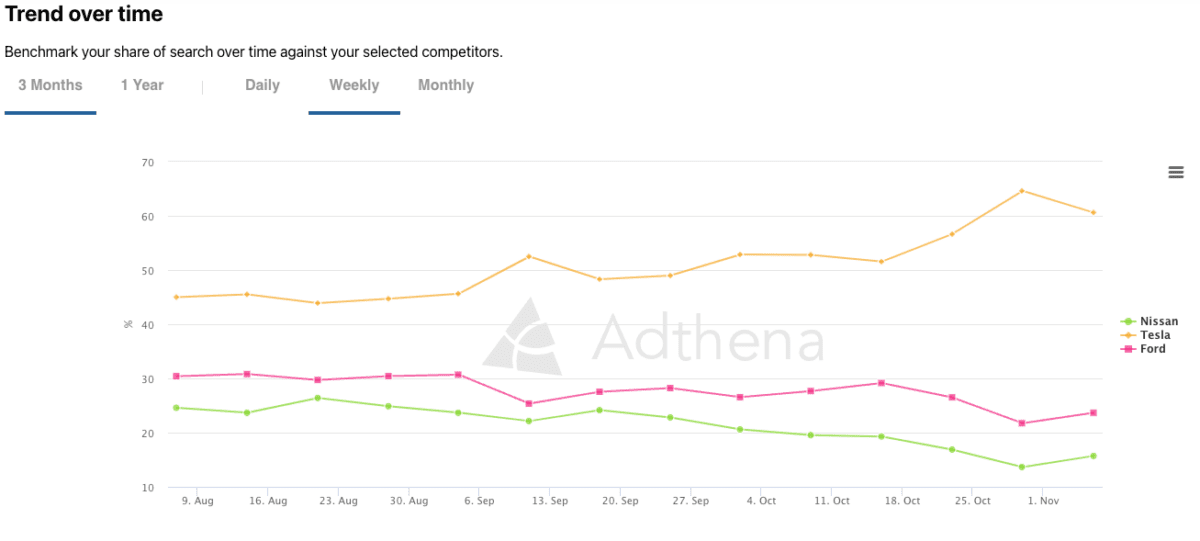
Trend over time: Tesla continues to gain ground in EVs
Looking at the trend over time report, you can see how each brand’s SoS is changing over a 3-month or 1-year period. Here, we can see that Nissan and Ford are holding steady for the most part, while Tesla continues to gain share of search over time. A savvy competitor would want to know why Tesla is on the rise and would dig deeper into their search strategy for clues.
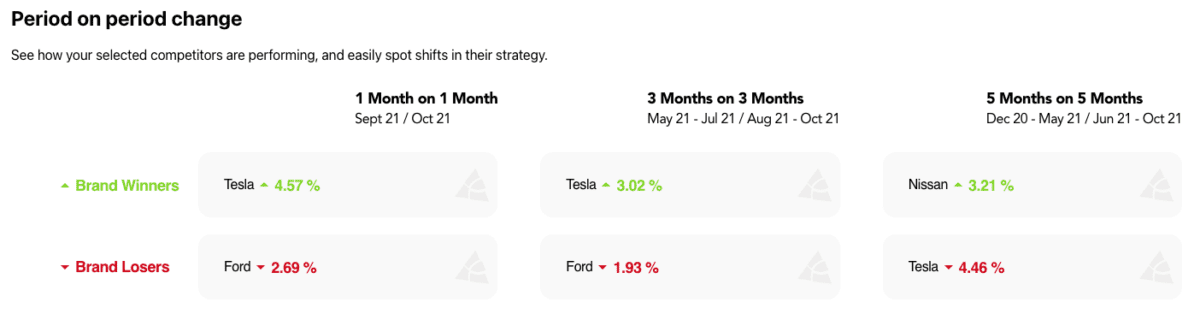
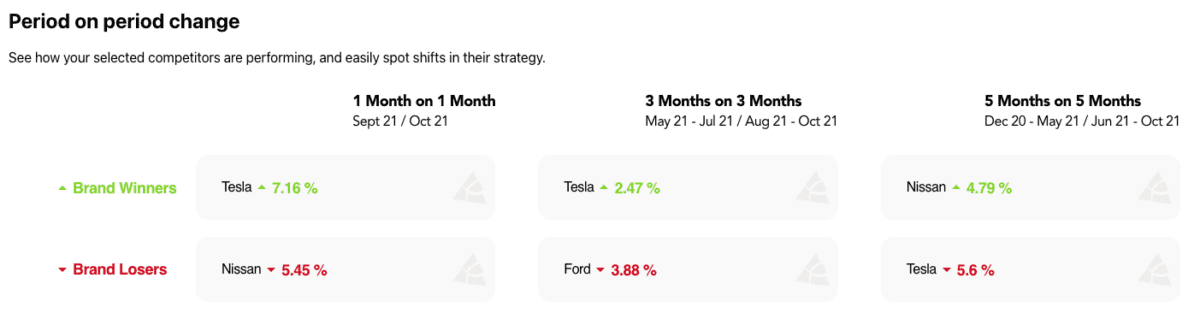
Period-on-period view: Is Nissan making an EV move?
This report shows you several Period on Period comparisons to surface shifts in a brand’s strategy. Here you can see that Nissan picked up more than 3% SoS on our EV terms during the five months ending in October, while Tesla lost more than 4% during that same time period. Is that a red flag for Tesla to investigate?
Same reports, new region: How does SoS play out in Canada?
The SoS calculation tool lets you choose any of 10 global geographies, which can surface vital differences to inform your regional search strategies.
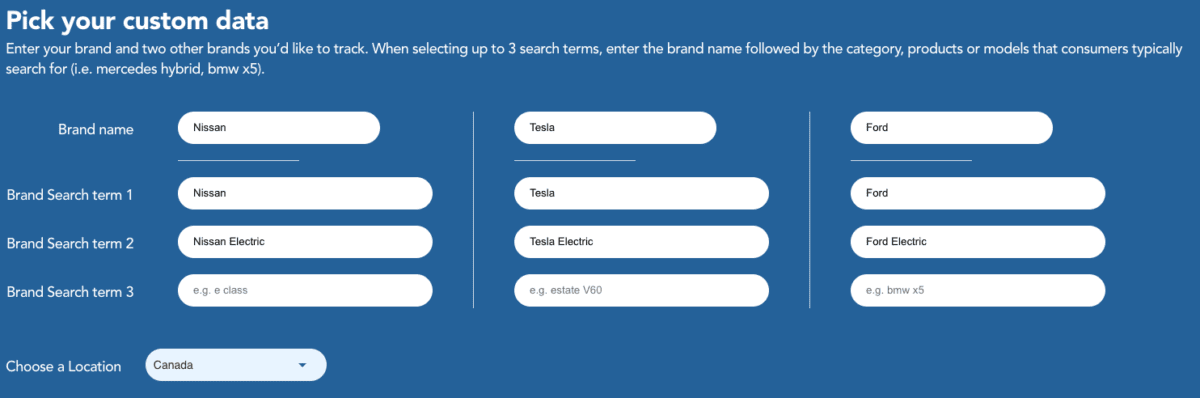
If we run the same reports as above for Canada, for example, we see that Tesla’s gains on EV-related search terms are even pronounced than in the U.S. market.
Try out the Share of Search tool now
The SoS metric provides powerful insights for understanding your market, benchmarking your performance vs. competitors, and assessing if your search tactics and overall marketing strategy are having the impact you intend.
Our free SoS tool gives you a snapshot in seconds and can expose all kinds of strategic possibilities the Adthena platform and lauren.feuer@adthena.com can help you explore