Interest in electric vehicles (EV) is charging up around the globe, with sales soaring in the UK as other vehicle sectors decelerate. In North America, the EV market is just as hot, with new vehicles even taking center stage at the Consumer Electronics Show in Las Vegas in January – once an event reserved for the coolest new phones and other portable technology innovations.
In the US and Canada, the next 5 years will see more manufacturers, more models, and more drivers in the EV landscape. That means more competition, too, and automakers will need to monitor the landscape carefully for new threats and new opportunities.
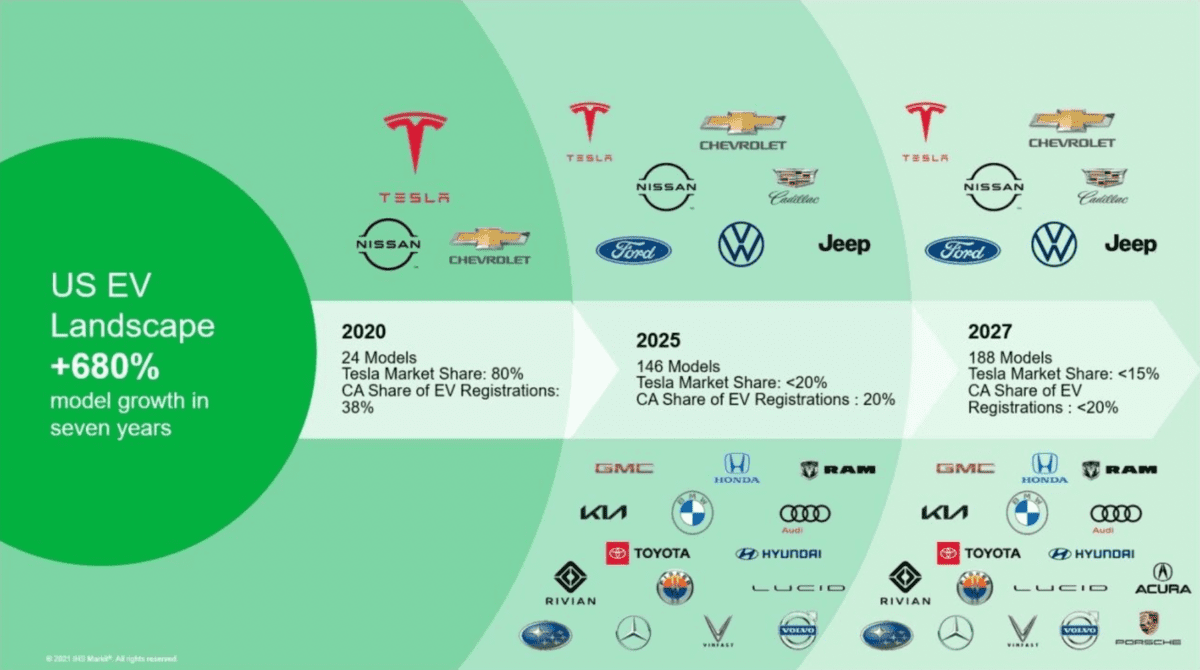
Credit & Source: IHS Markit Reports
Understanding demand in a new frontier
In North America, demand for automobiles is very regional. Boston drivers and Butte drivers may both want EVs, but they will want different models, features, and incentives. As a result, assessing demand by dealership, city, state, and region will be vital for automakers to optimize vehicle allocation, promotions, and competitive positioning. But how?
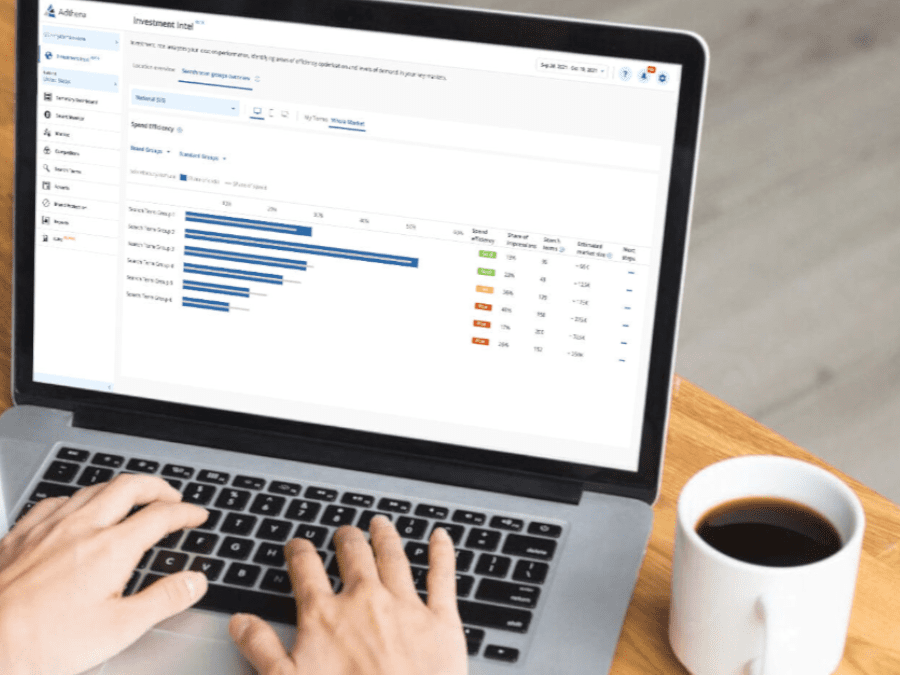
Using Investment Intel to optimize your search strategy
Imagine you’re Nissan. You’re rolling out your beautiful new 2022 Ariya electric SUV and want to measure performance in multiple locations. Or maybe you’re getting crushed by Tesla on a couple of key search term groups that are absolutely critical to your overall launch strategy. For either challenge, Google tools aren’t much help. But if you have local search intelligence for all locations and competitors, you can better understand and improve your overall spend efficiency everywhere you run search campaigns. Here’s how that might play out for Nissan.
Meet your new favorite metric: spend efficiency
Let’s say you (Nissan) want to run search campaigns for the Ariya in Ohio and Massachusetts. Here’s how you can ensure you are optimized for conditions in both states.
1. Compare your spend efficiency in those locations.
Spend efficiency is the ratio of share of clicks to share of spend across locations or search term groups. Combined with share of impressions, search terms, and estimated market size, it provides valuable context on your location-based performance and/or search term groups to surface opportunities for greater optimization.
In this case, your intel shows you that your spend is about the same in both states, a little bit more in Massachusetts than Ohio, but your click share is much higher in Massachusetts, indicating better spend efficiency in that state.
2. Review additional metrics to get context.
For example, you see that your market size is almost 3X in Massachusetts (~40M) compared to Ohio (~8.5M).
3. Investigate causality.
To unpack the reasons for your poor performance in Ohio. You can:
- Investigate market trends: Do certain competitors have a larger share of clicks in Ohio?
- Investigate movements: Is there a new competitor who has entered the Ohio market and is bidding aggressively in that state on the same search terms as you?
- Investigate search terms: Are you missing a search term that competitors may be using in Ohio?
- Investigate ad copy: What offers, CTAs, and incentives are competitors using in their ads that are resonating with consumers in Ohio?
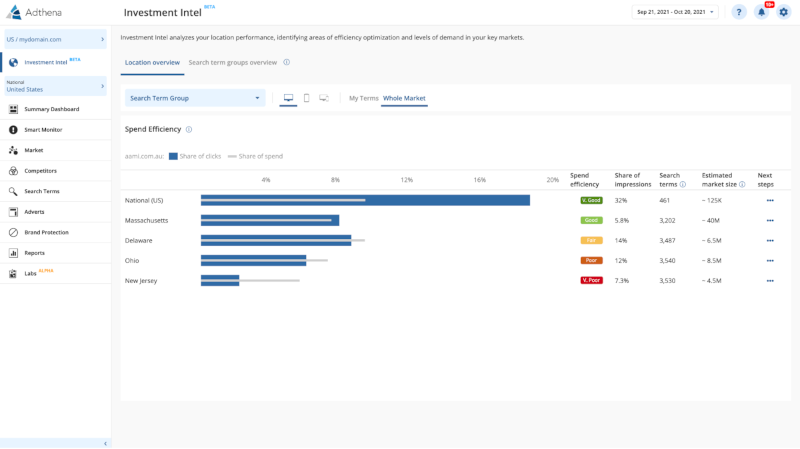
Above: Color-coding makes it easy to track and compare spend efficiency by location
4. Look at your search term groups by location.
This allows you to assess if your strategy is working and, if not, how you can reallocate spend to improve your campaign performance. It will also help you monitor changes and investigate further.
You can explore market trends to see if a new competitor has entered the market. Or is there a new promo from a competitor? Is someone being more aggressive? Is this just in one product line? Is it a certain competitor?
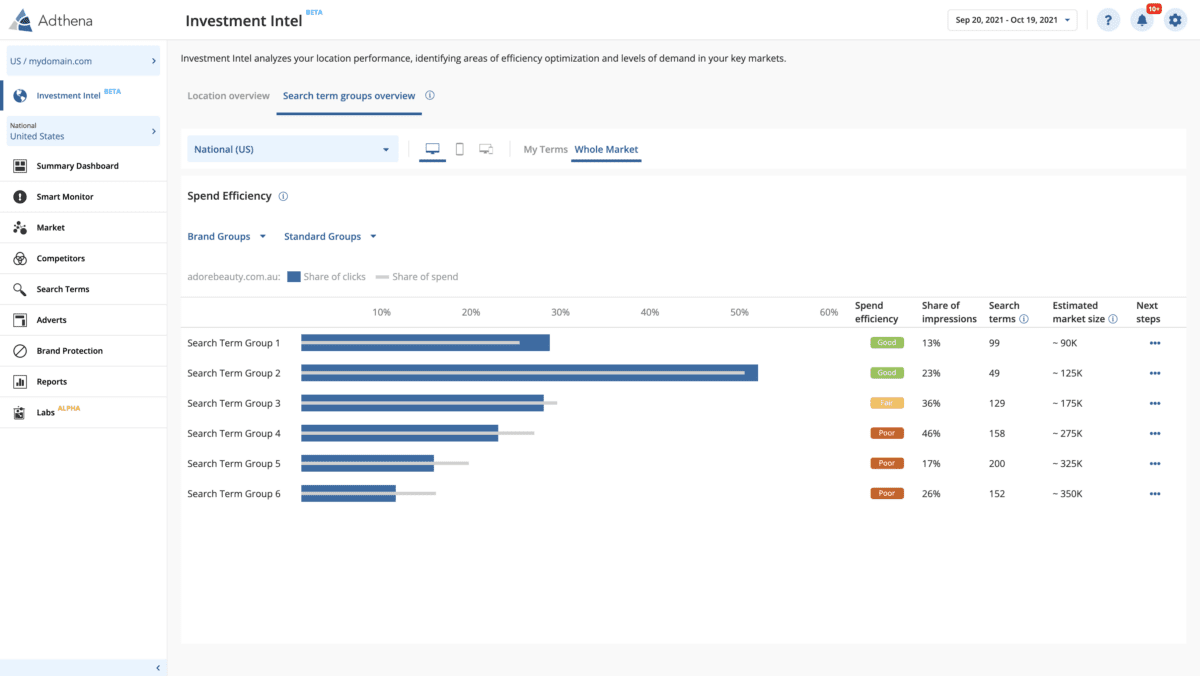
Above: Toggle between Location Overview and Search Term Groups Overview
This approach provides an overview of your main search term group’s performance at a high level for budget planning. Furthermore, you can:
- Understand spend efficiency and conversions across all search term groups
- If you’re in charge of spend allocation, understand granular details to decide where to reallocate the spend
- Investigate, escalate, and share major changes with your team and organization so they can, too, can understand the impacts of factors such as seasonality, new competitors, new products, or aggressive marketing
- Understand how your brand is performing across search term groups nationally so that you can make strategic decisions on budget allocation and improve your overall return on search investment
- Dig deeper to quickly get an understanding of the electric vehicle market in the US as a whole
Spotting threats and opportunities
Below, you can see Polestar making a recent big play on mobile clicks in the EV market to keep up with Nissan. In this instance, you would want to investigate the specific search terms involved as well as how their increase in spend was directly correlated to this increase in click share.
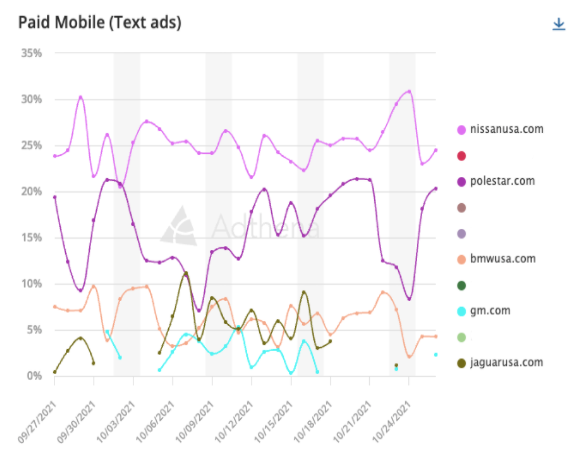
Above: Adthena data – Share of clicks on ‘EV’ search term (US)
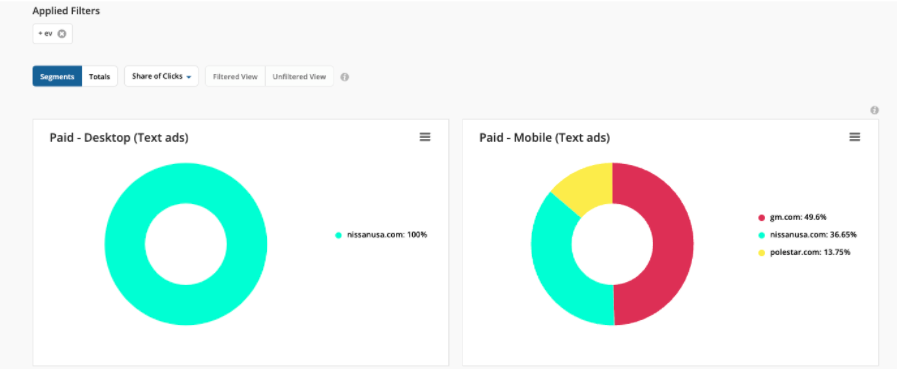
Above: Adthena data, Nissan is dominating click share for the term “EV” on desktop ads, but GM and Polestar are making a play on mobile. Clearly, this is paying off for GM.
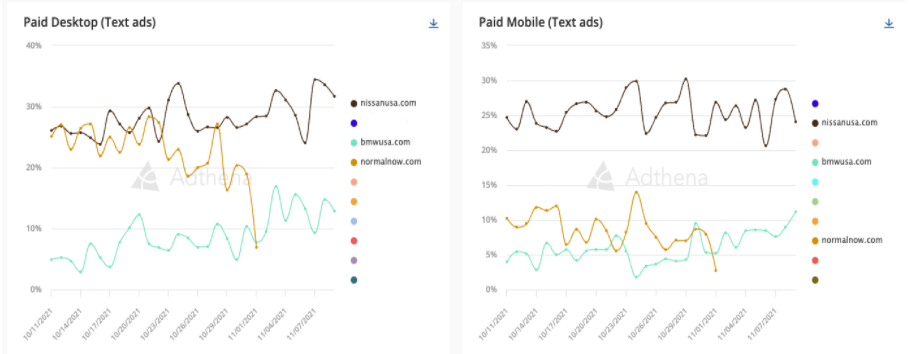 Above: Adthena data, you can also spot major shifts in the landscape as NormalNow completely dropped out of the search for EVs at the beginning of November.
Location matters; start here
With Adthena’s Local View, and Investment Intel capabilities allow automakers to optimize search spend and manage efficiency across multiple locations. If they want to look at performance at a national level, they can leverage Investment Intel across multiple search term groups, saving time and boosting ROI.
For strategy optimization, budget justification and reallocation, and competitive and consumer insights for multi-location advertisers, only Investment Intel gives you the visibility you need.
Log in to check it out now or schedule a demo here