How do your clicks and impressions compare to your top industry competitors? How about your overall share of spend? Which rivals have the edge in mobile? Having that information at a glance can give you vital information about movements and opportunities in your market. It can give you the power to spot shifts and act on them, identify areas of inefficiency, and strategically target key competitors to capture market share. Right now, you get that data in seconds with our free industry benchmarking tool.
To instantly generate your benchmark reports, you’ll select your industry (automotive, financial services, gaming etc.) and then choose a category (eg. auto parts vs. auto service) and the type of ads you want to examine (organic vs. text ad vs. shopping). Adthena’s industry benchmark reports will then show you multiple angles on your and your rivals’ performance across diverse metrics.
Here are a few of the benchmark views you can leverage, using automotive manufacturing as our category example.
Advertising comparison view: Does Jeep have a creative edge?
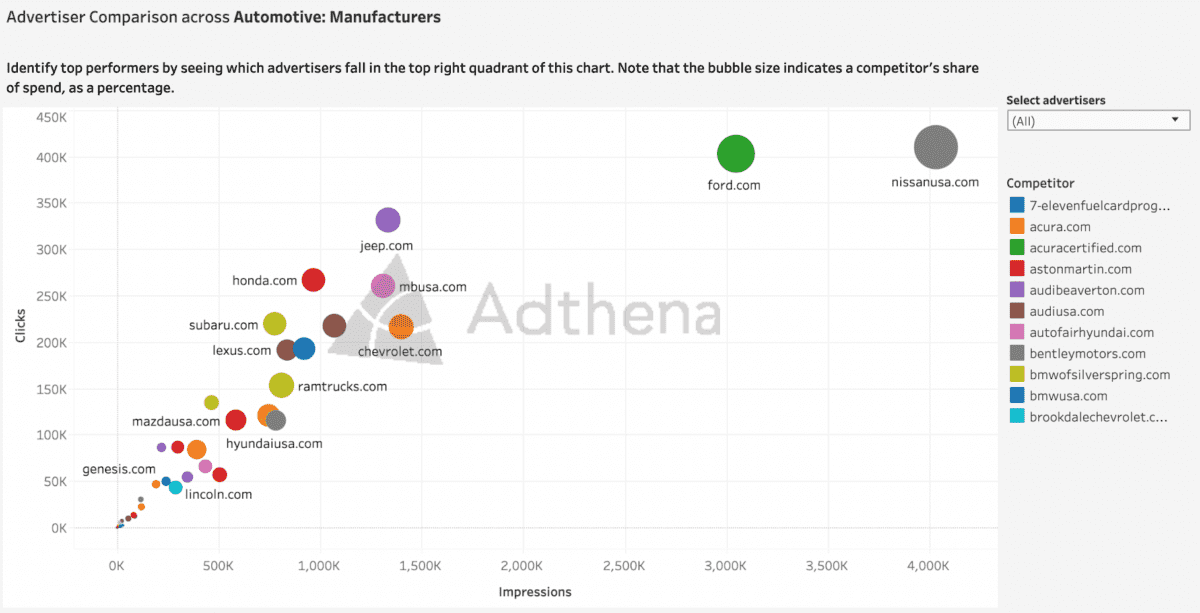
The advertising comparison report shows you top performers in a quadrant format.
The size of each brand’s bubble represents their share of spend, and hovering over any bubble reveals more specific information. As you can see here, Nissanusa.com is the industry leader for impressions and share of spend, but digging into Jeep.com’s performance may reveal a well-planned PPC strategy.
Hovering over the Nissanusa.com bubble reveals that Nissan has:
- Clicks: 60k
- Estimated impressions: 569k
- Share of spend: 17.2%
But Jeep.com is performing more efficiently:
- Clicks: 45k
- Estimated impressions: 172k
- Share of spend: 5.1%
Nissan may be leading the way in impression but are only achieving 15k more clicks than Jeep with a substantially higher share of spend. Clearly, something about Jeep’s ad creative is working well, and Nissan could use Adthena tools like Creative Insights to dig into Jeep’s creative strategy and perhaps improve its own.
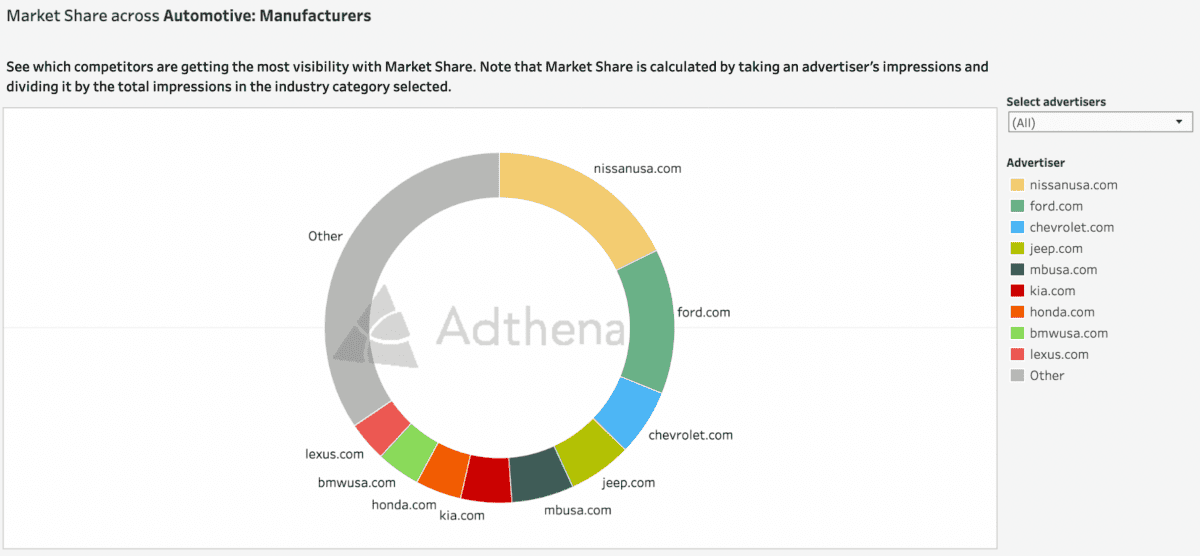
Market share report: Nissan leads for impression share
The market share report shows which competitors are getting the most visibility in your category. Again, hovering over any brand reveals details.
Here, for example, we can see that Nissanusa.com has 17.5% of total impressions in the automotive manufacturing category, leading top rivals Ford, Chevrolet & Jeep. However, Nissan’s share of spend is substantially greater than Jeep but they are not achieving more clicks for their search investment, here Nissan could investigate why Jeep’s strategies are performing better.
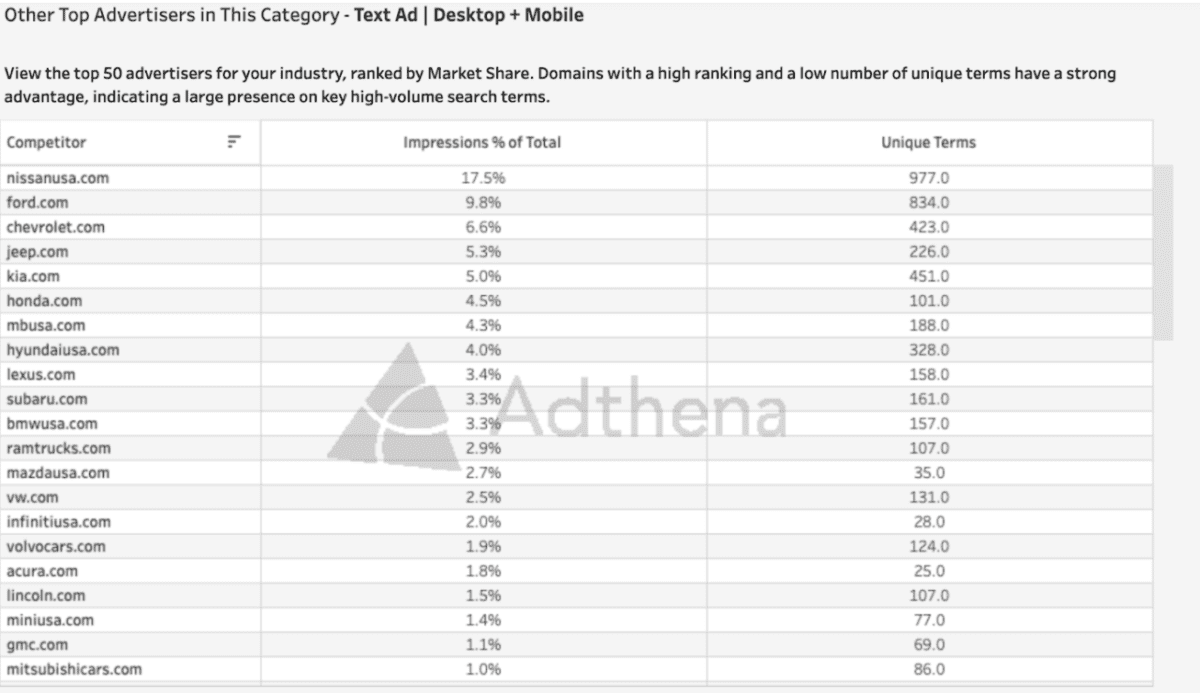
Market share top-50: Are you spending wisely?
This benchmark report gives you a snapshot of the top-50 advertisers in your category, ranked according to market share (i.e. impression share).
In this view, the ratio of impressions to terms is revealing. Domains with a high ranking and a low number of unique terms have a strong advantage, because they have a large presence on key high-volume search terms.
For example, Nissanusa.com has 17.5% impression share on 977 unique terms, while Ford.com has just 9.8% impressions on a similarly high number of unique terms (834). Jeep, however, is performing very efficiently with over three-quarters of the number of terms, making them the brand Nissan might want to watch. It also begs a question: Is it time to double-down on those highest-value terms and cull out low performers? The Adthena platform can illuminate the right path forward.
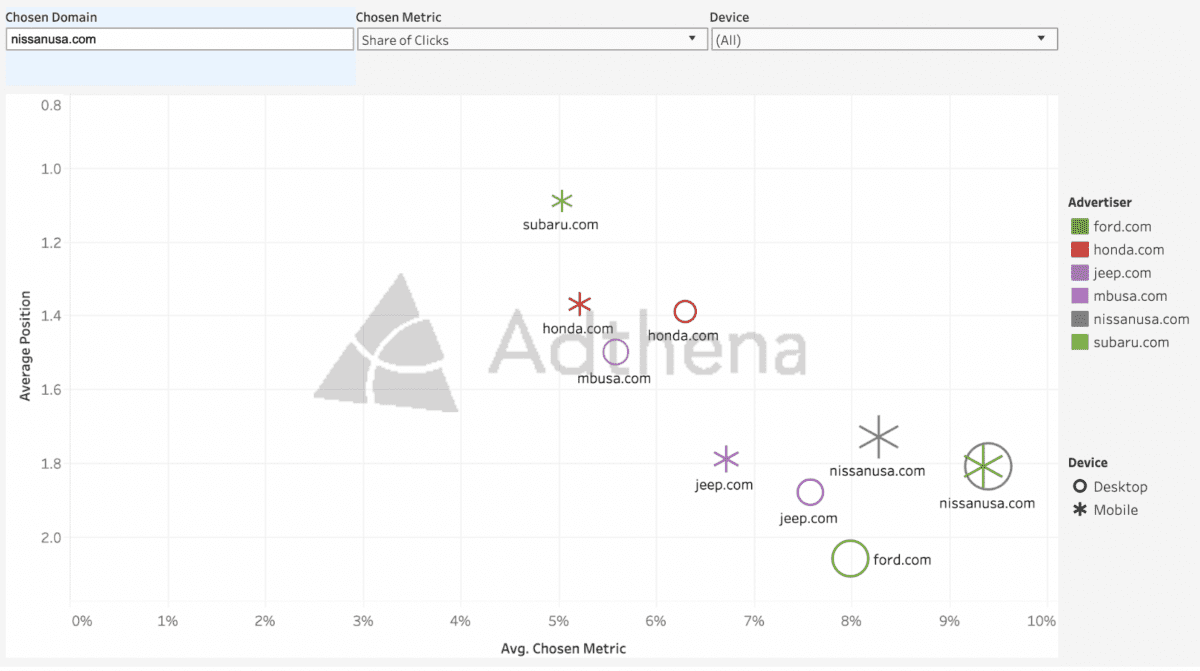
Brand comparison: Who’s dominating the SERP?
The brand comparison report lets you drill down on top competitors based on their average position and then toggle between share of clicks and share of spend. The size of the symbol represents estimated impressions, with circles representing desktop traffic and asterisks indicating mobile traffic.
In the instance below, we’ve entered Nissanusa.com as our example domain and share of clicks as our KPI. Note that while Nissanusa.com and Jeep are fairly balanced between desktop traffic and mobile traffic, Ford.com appears to be much more invested in mobile, a strategy Nissan might want to keep an eye on. Just keep in mind that this is including clicks from paid and organic search traffic.
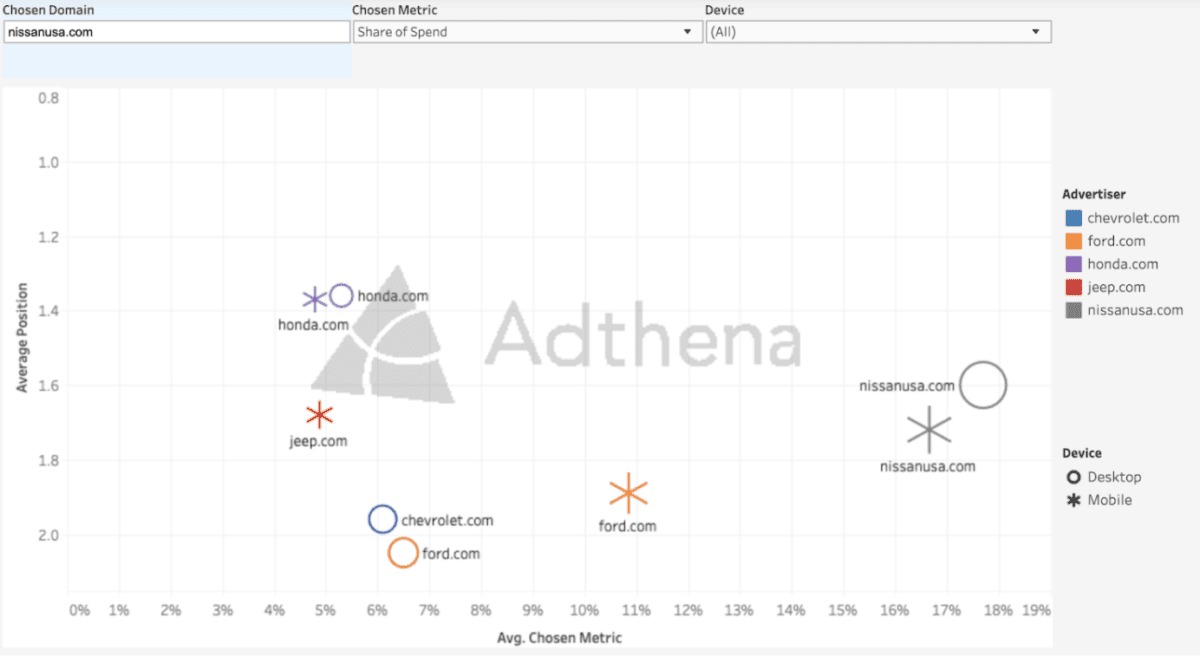
Below, we’ve run the same report, but with share of spend as our selected metric. You can quickly see that Jeep.com has a better average ad position on mobile compared to Nissanusa.com. That could indicate higher quality scores, better ads, or a more relevant landing page experience for the user — all things Nissan can investigate and emulate to gain traction. An interesting note is that Jeep.com appears to have no desktop presence, this may be aligned to their get out and explore marketing strategy.
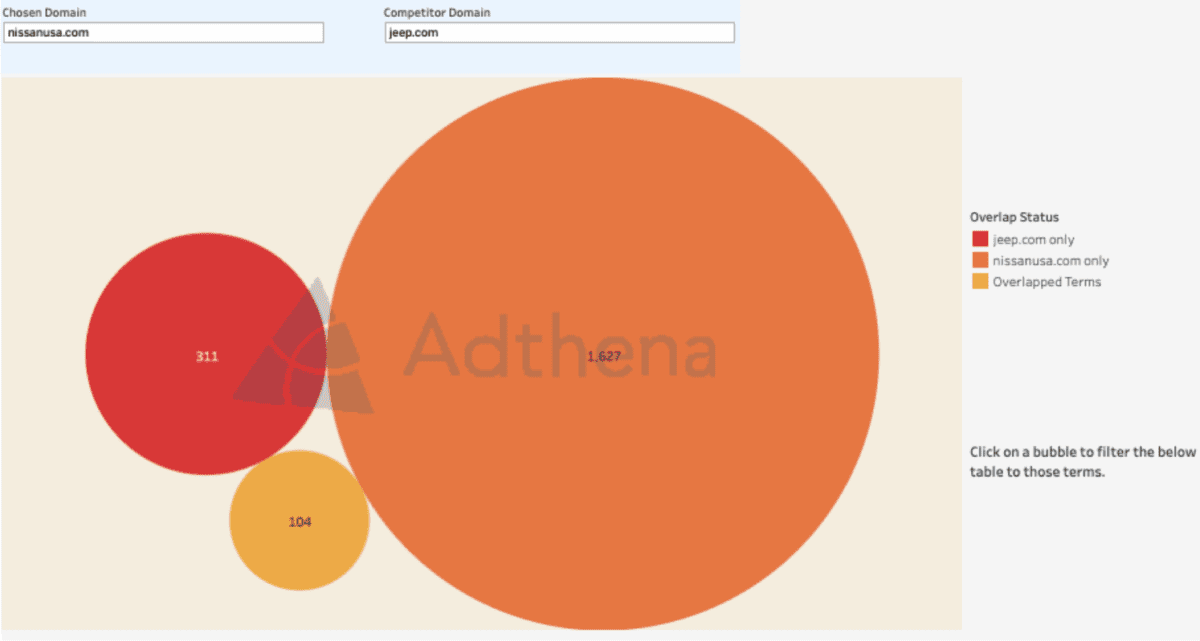
Head-to-head comparison report: Zero in on any rival
Using the above benchmark reports will give you an idea of who your top competitors are and either where they have vulnerabilities or where you need to push back. That’s when a head-to-head look (below) becomes very useful.
Based on the above examples, one Nissanusa.com’s main competitors appears to be Jeep.com, so learning more about Jeep’s strategy could reveal opportunities for Nissan to gain ground. For example, Nissanusa.com has 1,163 unique search terms compared to Jeep’s 311. But what about those 104 overlapping terms?
Clicking on the yellow circle below provides a granular look at those shared terms, with estimated clicks and impressions for each brand.
Take our benchmarks for a spin — what might you discover?
Try out Adthena’s free industry benchmark tool now, or reach out to lauren.feuer@adthena.com to learn more about the full scope of competitive insights you can get with the Adthena platform.